The CrossTab control displays "cross tabulation" calculated values in a grid format, with columns, rows, and cell values. To define a CrossTab, place the control on a report Detail section and then right-click upon the object and select the "Configure..." menu option. A diagram of the CrossTab definition is then displayed.
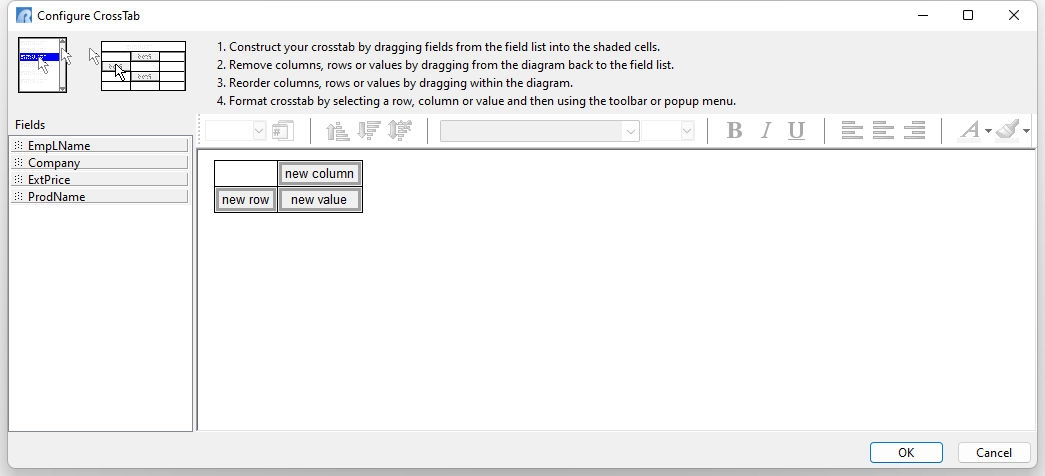
Within this window, users can specify column dimensions by dragging fields from the field list into the "new column" cell. Row and value dimensions can be created by dragging fields into the "new row" and "new value" cells. When the CrossTab is generated, the row and column dimensions that you define become the captions which appear on the outside edges of the CrossTab grid. The unique field values for each dimension become the caption values. The value dimensions which correlate to the given row and column values are displayed within the grid. If there are no corresponding values for a given column/row pair, a blank is displayed.
As an example, create a CrossTab report to display a customer and product analysis to show the totals for computers purchased. Use the RRBYW20 sample database to base a new report on the TCrossTabView view. The view stores the companies, product, and price for purchased computers. After the Report Designer is launched, add a CrossTab control to the report, and right click on the CrossTab to select the Configure option. Then, begin dragging the fields to the cells.
For the Company field, drag the item into the white space to the left of the "new row" cell. Notice the arrow pointers.
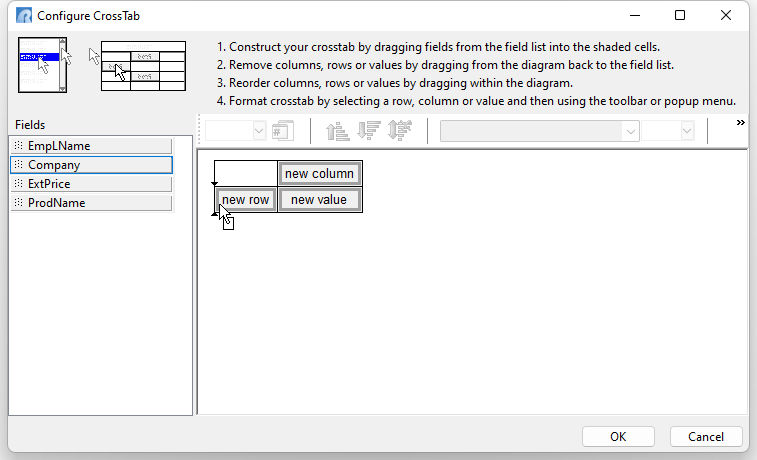
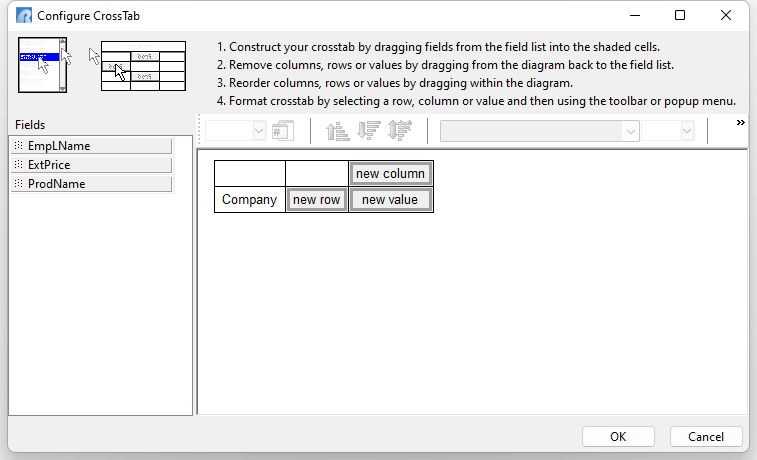
Release the mouse button to drop the field. The Company field will be listed. The placement of the field at this location will list the company names along the left side, going down. Alternatively, the Company names can be listed across the top of the CrossTab, where the field can be dragged above the "new column" cell.
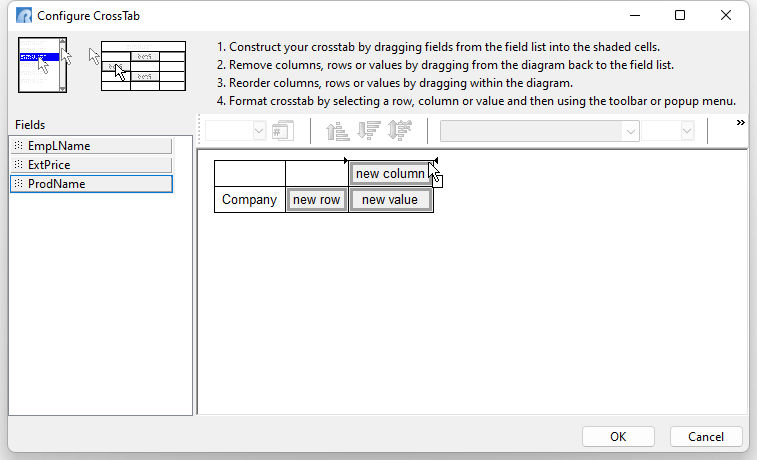
The same drag and drop steps can be performed for other fields. For the ProdName field, drag the item into the white space on top of the "new column" cell. Again, notice the arrow pointers.
Next, drag the ExtPrice field between the "new column" and "new value" cells.
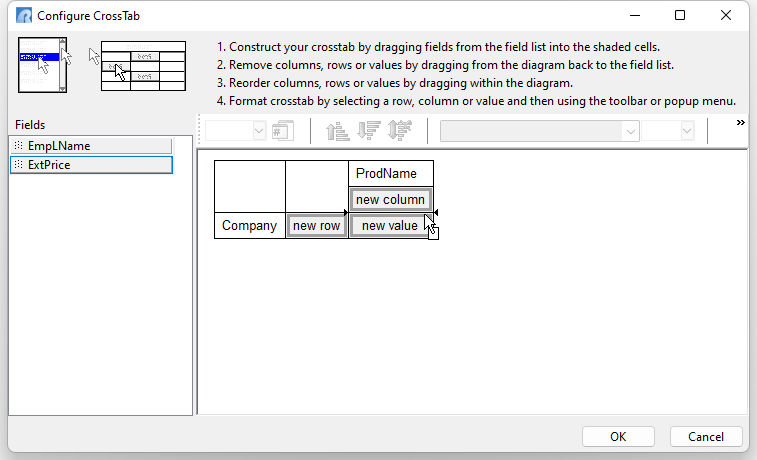
No other field placement is required. The fields should appear as follows.

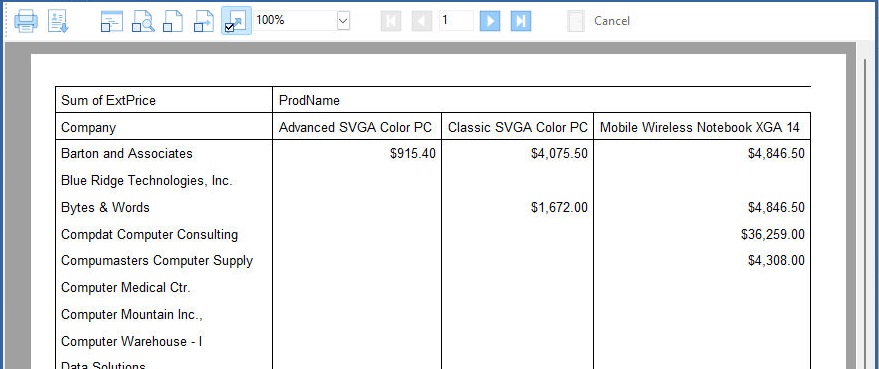
The "OK" button can be selected, and the report previewed, to review the field placement and how the data is displayed within the CrossTab control.
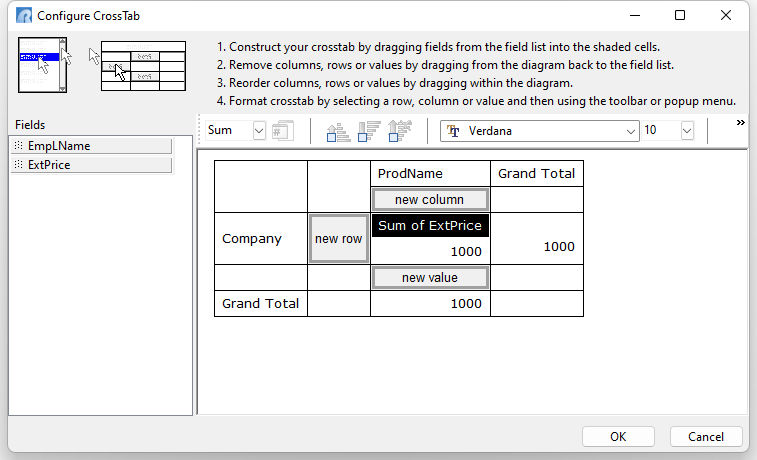
Once finished, return to the design area, right-click upon the CrossTab and select the "Configure..." menu option. One thing that may have been noticed is the formatting for the ExtPrice fields, where a currency was not properly displayed. To correct the format, right click on the "1000" items and choose "Display Format" from the menu. Select the fifth format in the list, ($#,0.00;-$#,0.00) and select OK. The format will be displayed for all three currency values.
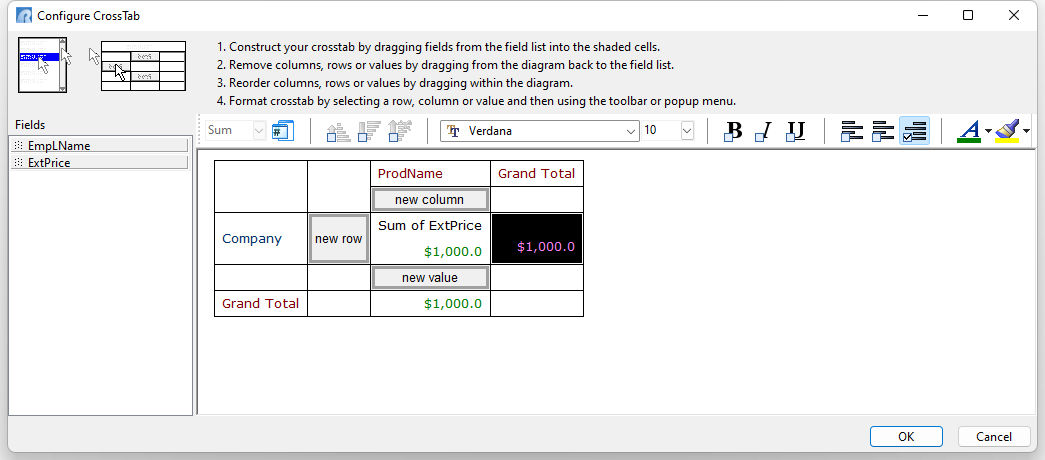
By default, the font in the CrossTab is Arial 10. To fit more data on the report, change the font to Verdana and the size to 7, using the "Layout" options. When reviewing the font names in the drop down, press "v" on the keyboard to advance to Verdana. The 7 may be typed directly into the font size field, without using the drop-down menu. The font name and size needs adjusted for each CrossTab item individually. The items will then appear as follows:
The font colors may be altered, with bold, italic, and underline font styles. Display Format options are also available for non-text fields.
By default, the CrossTab control calculates the Sum of column value for each set of records. Calculations are performed for the set of records which match the given column and row cell. If there are no column or row dimensions, then calculations are performed for every record in table. To calculate other options such as Count, Minimum, Maximum, Average, or List, click on the "Sum of ExtPrice" cell in the configuration menu, and then select the "Calc Type" drop-down menu under the "Layout" options (on the far left). The calculation options include:
•Count - counts the number of records in each set
•Sum - sums column values for each set of records
•Minimum - calculates the minimum column value for each set of records
•Maximum - calculates the maximum column value for each set of records
•Average - calculates the average for each set of records
•List - generates a list of values
Another right click configuration option is Skip Nulls, which is checked/true by default. When retrieving a value for a column, row, or value dimension, Skip Nulls indicates whether the value should be skipped when it is null. Normally when a null or empty value is retrieved for a row or column dimension field, '(blank)' is displayed as the caption in the CrossTab. When a null value is retrieved by a value dimension, it is treated as a zero. Setting Skip Nulls to False will cause the caption or value to be included in the CrossTab.
If you have not done so, press OK to close the "Configure CrossTab" dialog, and return to the Report Designer.
Properties for CrossTab Objects
To set additional properties for CrossTab objects, right click upon a CrossTab control. The pop-up menu includes the following options:
•Grid Color - specifies the color for the grid lines
•Draw Horizontal Gridlines - specifies to display horizontal lines for the grid
•Draw Vertical Gridlines - specifies to display vertical lines for the grid
•Draw - determines whether the CrossTab will be rendered in the report. The default is checked/true.
It is sometimes useful to turn draw off and use the CrossTab control as a way of providing calculations in a report. Setting Draw as unchecked/false will keep the CrossTab from rendering. Setting Visible as unchecked/false will keep the CrossTab from both generating and rendering. Therefore, you will need to make sure that the Visible property checked/true if you intend to use this described technique.
•Pagination - determines the order in which CrossTabs will print, which do fit on a single page:
oAcross then Down - prints all of the pages across the top of the matrix, then prints the next "row" of pages, etc. until the matrix is completely printed
oDown then Across - prints all of the pages down the side of the matrix, then print the next "column" of pages, etc. until the matrix is completely printed
•Parent Width - specifies the width of the CrossTab to match the width of the parent control. The parent may be either a band or a region. Set this property to unchecked/false and resize the CrossTab in order to create "side-by-side" CrossTabs.
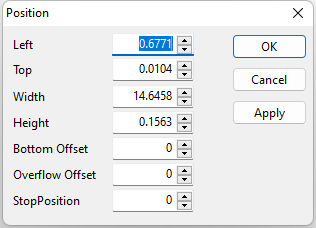
•Position - Opens the Position dialog window for specifying hard-coded coordinates
oLeft - specifies the horizontal coordinate of the left edge of a CrossTab control relative to the left edge of the parent band's starting print position
oTop - specifies the vertical coordinate of the top left corner of a CrossTab control. The value of top is relative to the value of a CrossTab control's parent band.
oWidth - specifies the horizontal size of a CrossTab in report units.
oHeight - specifies the vertical size of the CrossTab in report units
oBottom Offset - specifies the vertical space that should appear after the CrossTab has printed. The Bottom Offset is expressed in report units. Note: The Bottom Offset acts as a margin between the stretching controls and the controls that are shifting or stretching in relation to it.
oOverflow Offset - specifies the vertical space that should be above the CrossTab when it is overflowing onto an additional page. The Overflow Offset is expressed in report units. Note: The Overflow Offset acts as a margin between the stretching controls and the top of the page.
oStop Position - specifies the vertical position at which the CrossTab will stop printing. The Stop Position is expressed in report units. Note: Together with the Top and Overflow Offset properties, the Stop Position can be used to restrict the CrossTab to a certain position on the page. This is often useful when you are printing on pre-printed forms and need to print information within a certain rectangular area on the page.
•Reprint On Overflow - Reprint On Overflow applies to situations where a Stretchable component is stretching across pages. If the text overflows onto a new page, any components that are on the same band will reprint on the new page (if Reprint On Overflow is checked).
•Shift Relative to... - When multiple stretching controls occupy the same band, use this property to specify how each control should be positioned relative to other stretching controls. "Shift Relative to" can only be used for controls that are dynamically sized. If you have a static control, such as a label, which needs to shift relative to a given stretching control, then place the control in a region and set the Region's "Shift Relative to" to the stretching control.
Note: When stretching controls are placed within a region, the "Shift Relative to" property is disabled. You may notice that all of the stretching controls in the band do not always appear in the Shift Relative to dialog when you are assigning this property. This is due to validation logic which ensures that controls which are shifting relative to one another are not involved in a circular reference. In other words, if Memo is shifting relative to DB Memo, then DB Memo cannot shift relative to Memo, as this would create a situation which the report designer could not resolve. Stretchable controls include Memo, DB Memo, Region, Rich Text and DB Rich Text.
•Shift With Parent - Shift With Parent applies to situations where a stretchable component is stretching. If Shift With Parent is checked, the report component will move based on the amount of stretching the text requires. When you want components to appear at the bottom of a Rich Text object, this is a useful feature. If the object stretches to a new page, the components will print on the next page.
•Stretch - specifies whether the height of the CrossTab automatically stretches to allow the entire contents of the CrossTab to be printed. The default is checked/true. When checked, the CrossTab will stretch, overflowing to additional pages if necessary.
•Style - specifies the "look and feel" of the CrossTab. There are two styles currently provided with the CrossTab control; "Standard" and "Repeated Captions". The Repeated Captions style forces the CrossTab to reprint the appropriate row and column captions when a CrossTab does not fit on a single page.
•Visible - specifies whether the CrossTab control will be printed. Note: If Visible is unchecked/false, then the CrossTab grid will not be generated. If you want to hide the CrossTab rendering, but still generate the CrossTab grid, use the Draw property.