The Trace Prompt is a toolbar where any meaningful R:BASE command may be manually entered and executed within the Trace Debugger, behaving very similar to the R> Prompt.
Any command can be used to define variables, open a table, launch the help for a command/keyword, open the Command Builder [F5], and pretty much anything the original R> Prompt allows, as far as entering commands.
During debugging users may inspect data, evaluate variables, break out of a loop, review settings, and generally enhance the testing and debugging of command files and applications.
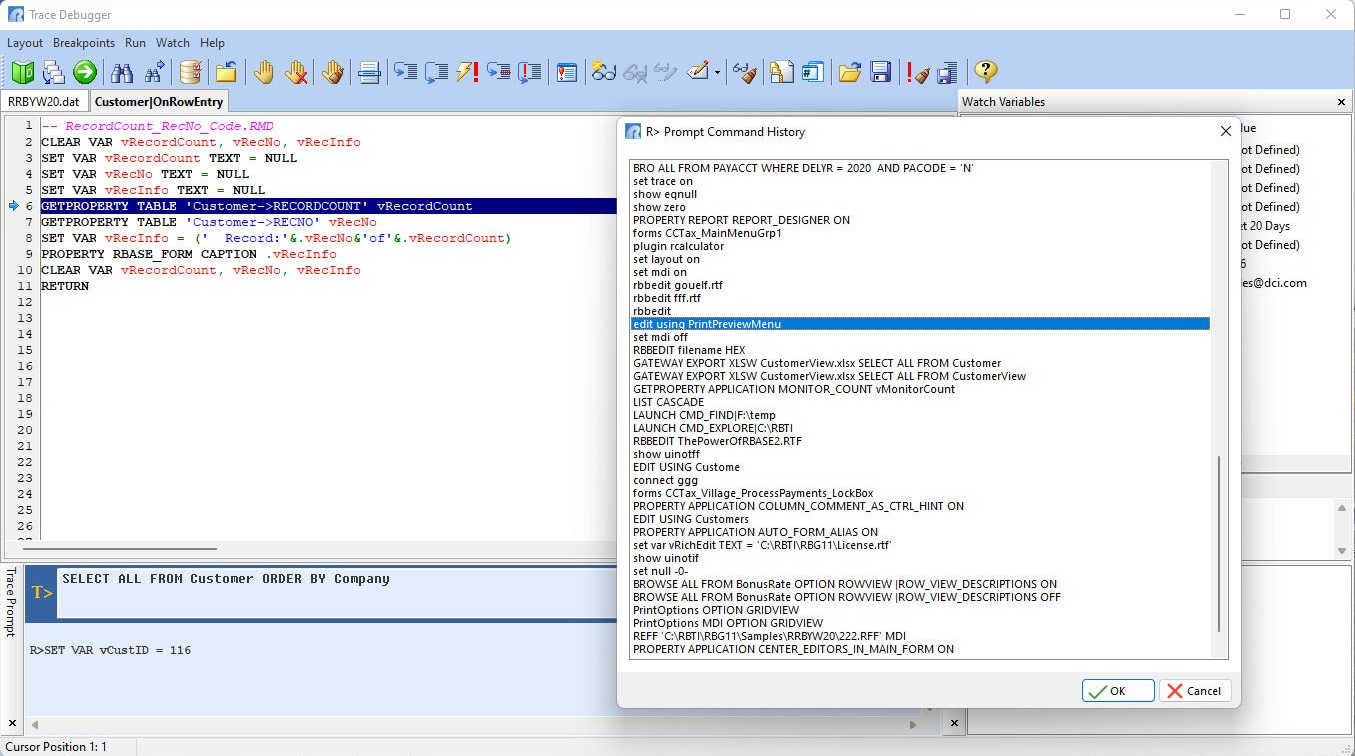
Command History
The Trace Prompt is tied to the R> Prompt's Command History, where the [Page Up] and [Page Down] keys cycle through previously used R> Prompt commands.
The R> Prompt's Command History may be displayed with the [Ctrl+H] key combination, when focus is in the T> input console. When a command is selected/highlighted in the history and the OK button is clicked, the string is inserted into the Trace Prompt input console and the window is closed. A command may also be double clicked, to insert the string into the Trace Prompt input console. Use the arrow keys to move up and down the displayed R> Prompt's Command History, and use the [Page Up] and [Page Down] keys to jump up and down the list. The [Ctrl+Page Down] and [Ctrl+Page Up] key combinations places the Command History focus to either the bottom or top of the list.
Any commands entered at the Trace Prompt are not added to the R> Prompt Command History.