The Data Tree Toolbar is a convenient way of placing column objects and/or labels on the report based on the available fields from the table.
|
|
Data Tab |
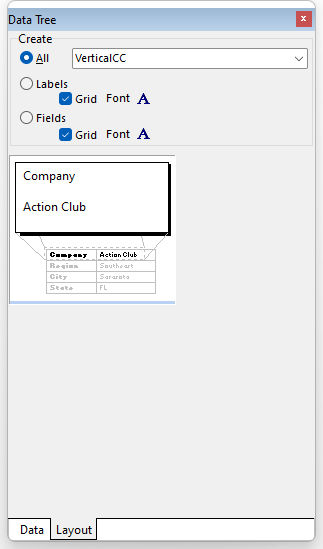
Layout Tab |
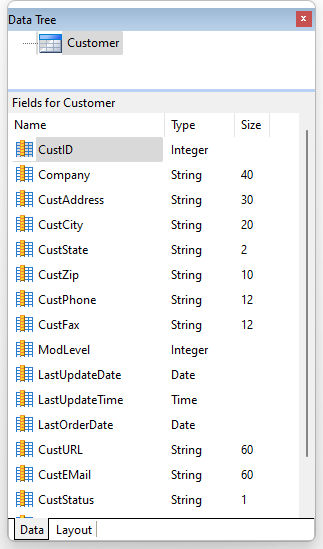
On the Data tab, you can see all the data fields and their attributes in the lower window. Here, you can select one or more column to drag onto the report.
The Layout tab determines what objects are created, and their Font size/style/color, when the fields are dragged onto the report template.
ð Create
All
Specifies that BOTH a Label and DB Label will be created for each field dragged onto the report template
•Style
Specifies the orientation of the Label to the DB Label, either Vertical (Label over DB Label) or Tabular (Label to the Left of the DB Label)
Labels
Specifies that ONLY a Label will be created for each field dragged onto the report template
•Grid
Toggles the grid option which places Shape objects around the Labels to give the appearance of a grid
•Font
Specifies the default font for each Label object placed using the Data Tree
Fields
Specifies that ONLY a DB Label will be created for each field dragged onto the report template
•Grid
Toggles the grid option which places Shape objects around the DB Labels to give the appearance of a grid
•Font
Specifies the default font for each DB Label object placed using the Data Tree
Note: The Data Tree will remain visible during the entire designer session when toggled on