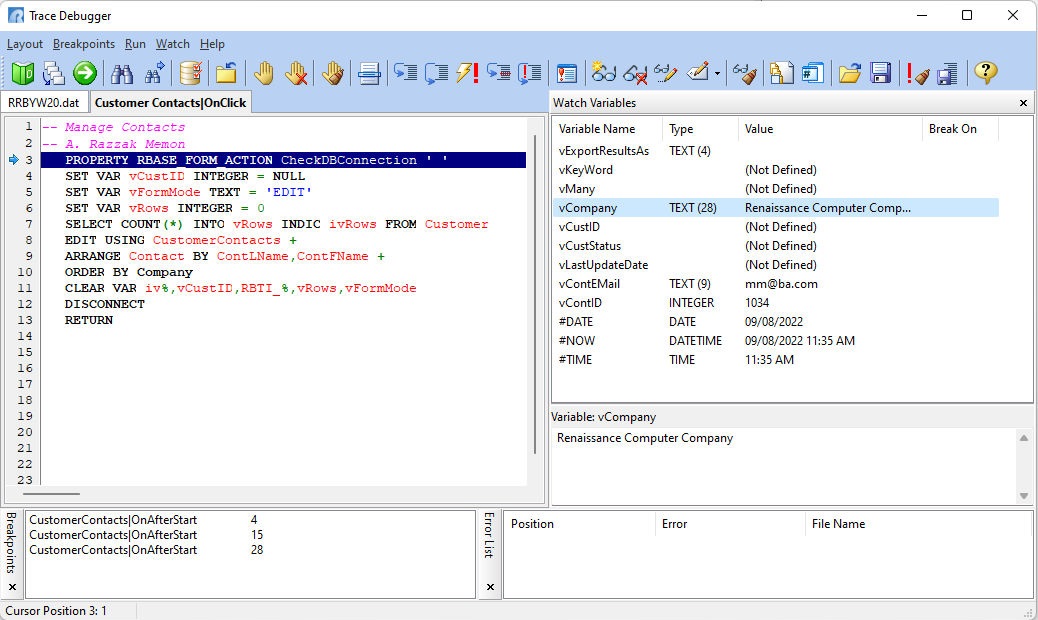
The Trace Debugger is a way for you to view your command files and R:BASE code as your custom application runs, allowing you to find programming errors and problems. The Trace Debugger pinpoints exactly where errors occur by allowing you to do the following:
•View the results of commands
•Find problems in application logic or command syntax
•Process individual commands, one at a time
•Process blocks of commands
•Jump to a specific line (up or down) when single-stepping through code
•Display variables, monitor their values, and break processing, if needed
•Display all variables as they are defined, altered, and deleted
•Change variable values
•Review application configuration settings while debugging
•Review the call tree in a command file hierarchy
•Save debugging configurations for the next debugging session
As opposed to the RUN command, which just executes the instructions in a command file, the Trace Debugger opens code and lets you observe the commands and variables as the instructions are processed. After the command(s) have executed or when the debugger pauses, the Trace Debugger updates variables being monitored and displays the command file/EEP code. Error messages appear when applicable.