The Trace Debugger allows developers to debug applications and commands files to find programming errors and problems. The debugger has been updated with the following new features:
•Trace Prompt toolbar into which any R:BASE command may be manually entered and executed
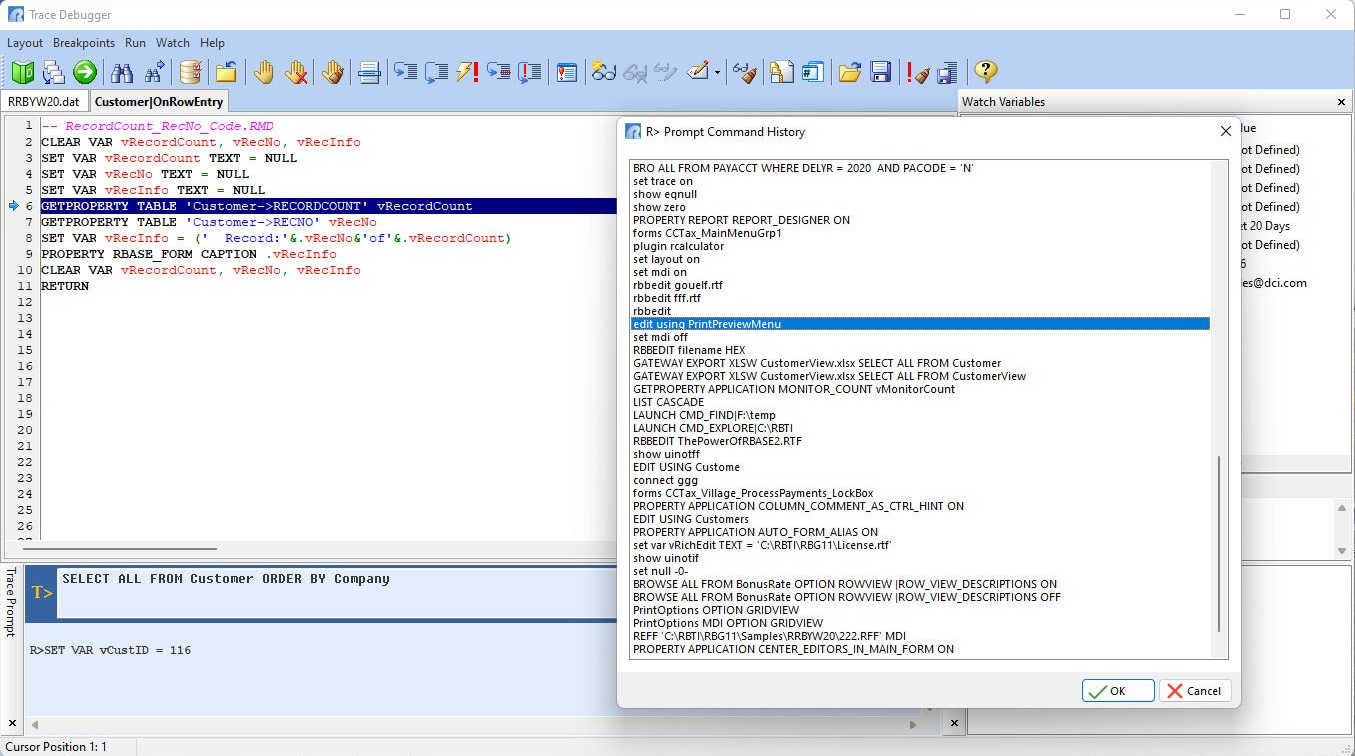
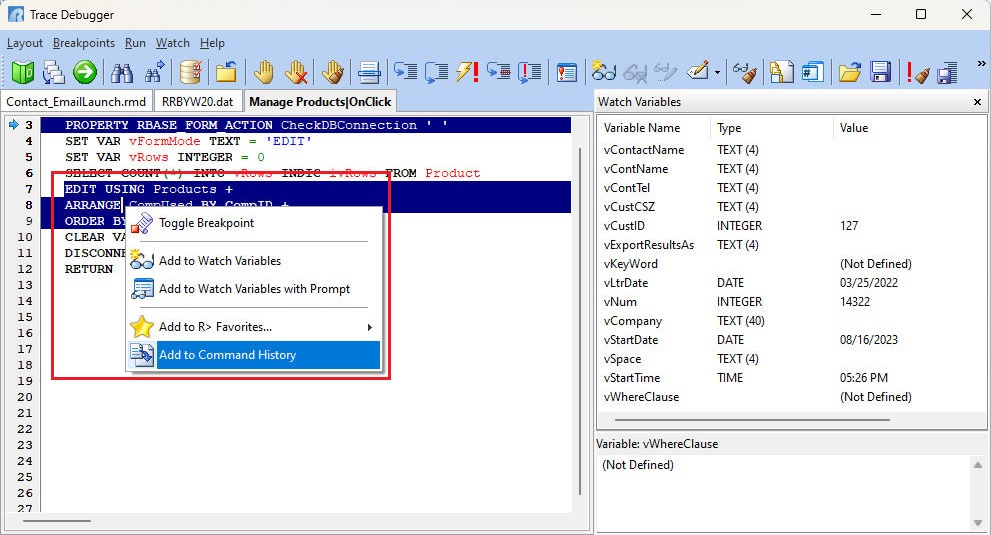
•Added right click menu option for when running a command file/EEP in the debugger, to insert a highlighted command into the R> Prompt Command History
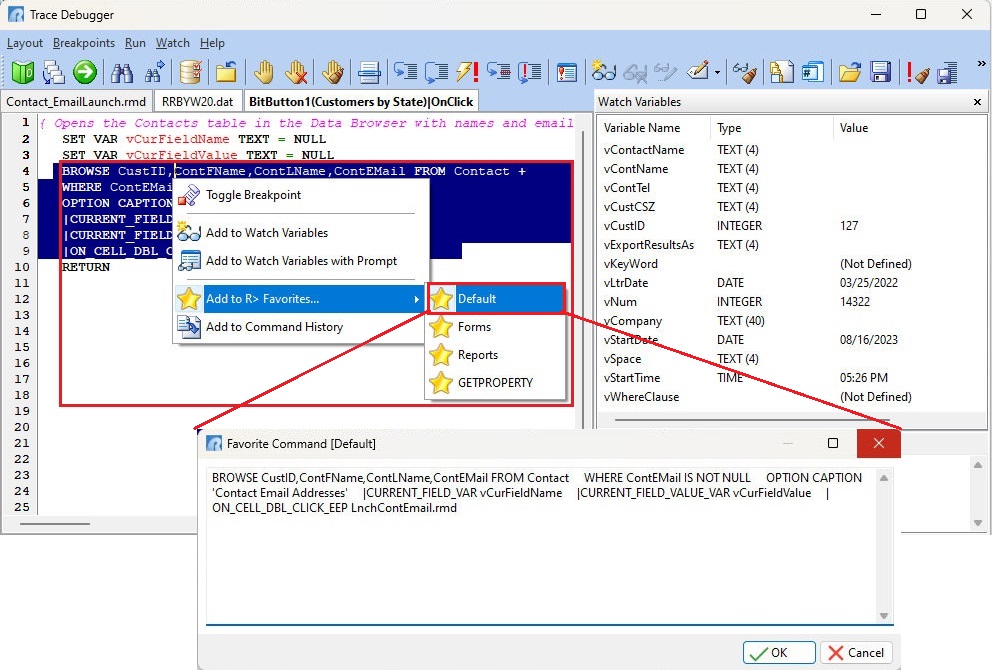
•Added right click menu option for when running a command file/EEP in the debugger, to insert a highlighted command into the R> Prompt Favorites
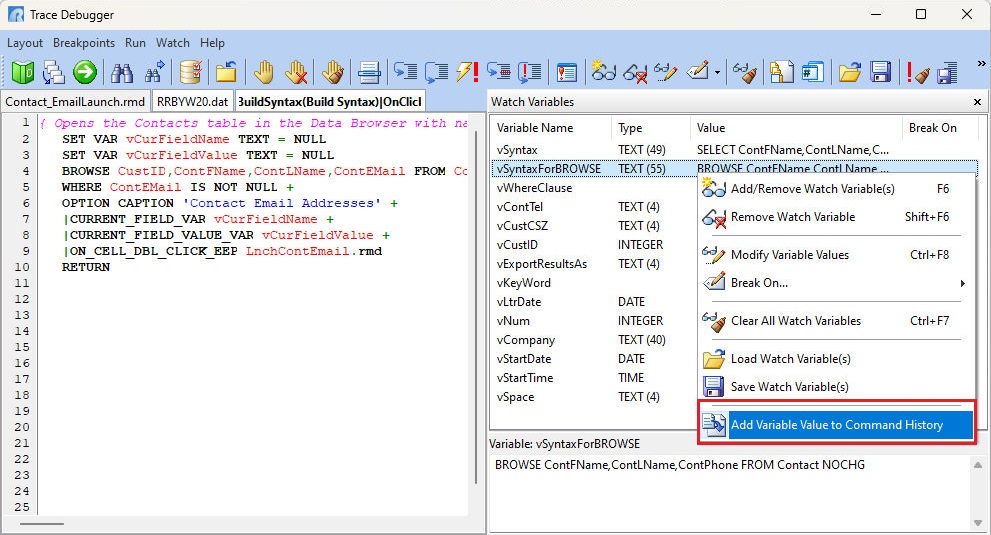
•New "Add Variable Value to Command History" menu option within the Watch Variable panel of the debugger to add dynamically constructed and complex ampersand-variable commands to the R> Prompt Command History. The functionality makes the complex command more accessible for re-execution (possibly with manual modifications)
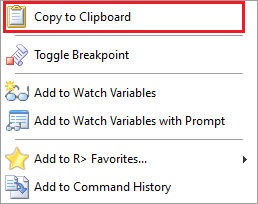
•Added right click menu option to copy highlighted text while debugging code
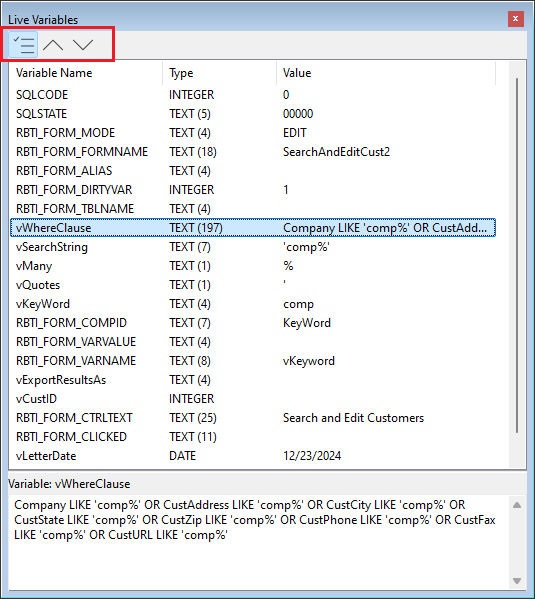
•Enhanced Live Variable list sorting with ability to toggle the dynamic list in ascending, descending, and most-recent order
Trace Debugger features added within R:BASE X.5 (Version 10.5):
•Added ability to display the Configuration Settings when tracing a program, to review and alter the current settings
•Added "Go to Line Number" functionality to the menu bar, and [F4] hot key, to easily place breakpoints
•Added friendly naming conventions for tab to identify the module and/or source from where the code is located. Tracing form controls will display ComponentID and Caption/Text (if exist) and the EEP name. Form code will display the form name with EEP or custom form action name. Tracing reports and labels will display the name and the action. The new friendly naming convention for the Trace Debugger tabs are:
•Added panel within the Watch Variables toolbar to quickly view the value of a selected variable with many characters
•Added "Jump to Line" functionality, where when single-stepping through code, a users may jump to a specific line in the debugger. This ability allows users to start debugging at a specific point, skip over commands, repeat commands, etc. The [F11] hot key also opens the "Jump to Line" dialog.
•New Live Variables toolbar which automatically populates with defined variables
Trace Debugger features added within R:BASE X (Version 10):
•Added Watch Variable Breaks, allowing the trace debugger to halt/break when:
othe variable is created
othe variable is deleted
othe variable has a null value
othe variable value changes
othe variable value equals a specific value
•Enhanced Trace window to scroll up and down using the mouse wheel when error breaks occur
•Added popup menu to right click and add watch variables and toggle breakpoints
Trace Debugger features added within versions eXtreme 9.0, 9.1, and 9.5:
•New option to clear the Error List Toolbar
•New option to save the Error List to a file
•Bold text is displayed within the "tab" for the file that is currently being debugged
•Dockable/Floating toolbars for custom display
•Enhanced Error List Toolbar to support jumping directly to the line where an error occurs
•Increased size for the "Modify Watch Variable" dialog field to display long variables
•Added alphabetical sorting of the Watch Variable list, to easily find a specific variable
•Added "Clear Error List" and "Save Error List" buttons to the Trace Toolbar
Trace Debugger features added within versions 7.x, Turbo V-8:
•Multiple File Tabbed Trace Interface
•Call Tree for Viewing Files Currently Being Traced
•Unlimited Watch Variables
•Multi-Pane Debugger Window Displays Command File(s) Being Traced, Selected Watch Variables, Defined Breakpoints, and Errors Encountered
•Quick Select for Watch Variables in Trace Debugger