The next improvement you want to make is to organize the report so that each date appears only once, and all the flights for a date are grouped under it. You create a breakpoint, which groups the rows by the values in a specified column; in this case, the column FlightDate. In addition, when you use a column as a breakpoint, R:BASE can sorts the data in the column in ascending or descending order. For example, the report will contain all the flights scheduled for 03/02/2022 followed by the flights for 04/01/2022, and so on.
To add a breakpoint:
| 1. | In the "Report Designer" window, choose Report: Breaks... |
R:BASE displays the "Breaks" dialog box. The drop down box contains a list of columns for the report to break on. We are using FlightDate.
| 2. | Choose FlightView:FlightDate from the "Breaks" drop down box of available columns. |
| 3. | Click the Add button. |
The first available breakpoint, Break[0], is added to the list of current breakpoints.
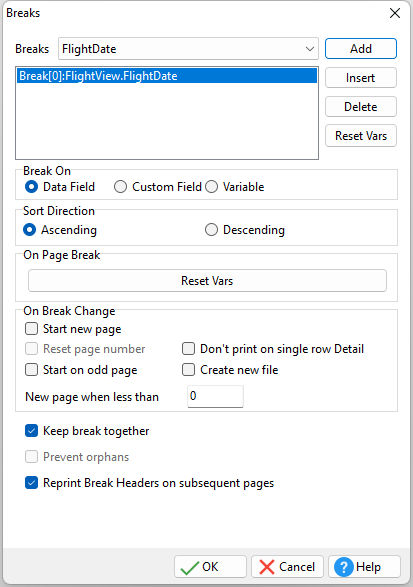
| 4. | All of the default setting will be kept. Click the OK button. |
R:BASE returns to the "Report Designer" window and automatically adds the Break Header and Break Footer sections to the report. The report bands are labeled with the name of the report section and the column that the sections break on, FlightDate.