Designing is the most important step in building a report. Knowing what you want to include and how you want it to look will help you create a useful report.
To design a report:
•Decide the purpose of the report
•Sketch how you want the report to look
You already know that the purpose of this report is to generate a list of employee phone numbers, but what should it look like? Here's a sketch for the report:
Employee Phone List
First name |
Last name |
Area code |
Phone |
Larry |
Miller |
206 |
881-0276 |
Charles |
Short |
206 |
564-9123 |
Jessica |
Jennings |
206 |
882-0274 |
Samuel |
Booth |
206 |
637-8241 |
David |
Wallace |
206 |
881-0382 |
Diane |
Vance |
206 |
227-8132 |
Virginia |
Hill |
206 |
565-9205 |
Use the sketch to identify the following:
•The driving table or view-this is the table or view on which the report is based. The driving table or view contains the rows and columns from which all or most of the data is gathered.
•Which columns to include
•The positioning of the columns on the report
•The report sections you'll need-There are five possible report sections. Each one has a specific purpose. You use report sections to determine how and where descriptive text will be printed and how the rows of data will be organized.
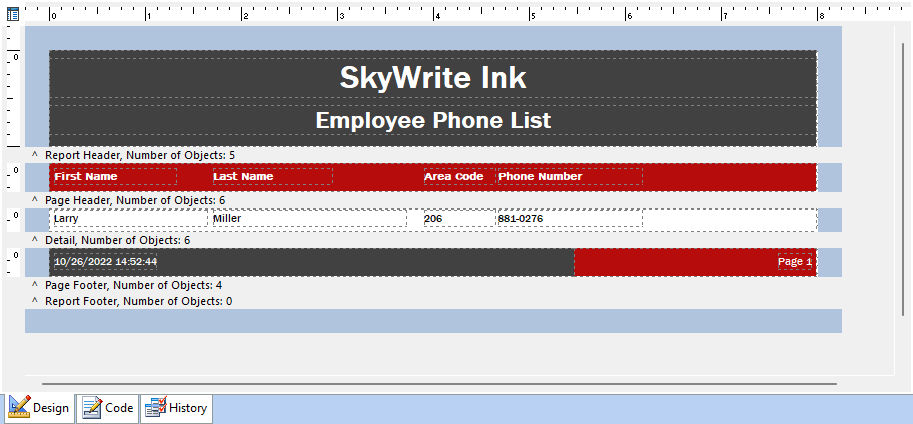
In this report, you want the title, Employee Phone List, and the column headings, First name, Last name, Area code, and Phone, to be printed at the top of each page. You'll place this information as descriptive text in a Page Header.
To print the names and phone number of employees, you'll place the fields for this information in a single line in the Detail section. The Detail section is repeated for each row of data drawn from the database.
Take a look at the finished report to see what you will be placing in the report sections.