The Report Designer includes all of the features and options you need to build reports for your database. Here, you establish your report layout, place objects to display text and data, and customize the look of your report. Once reports have been defined, the report names are listed in the Database Explorer.
Once you enter the information that R:BASE needs to build the report-the report name and description, the driving table, the columns you want to include, and the orientation-R:BASE displays the report in the "Report Designer" window. The following example shows the "Report Designer" window with the Employee Phone List report displayed in it.
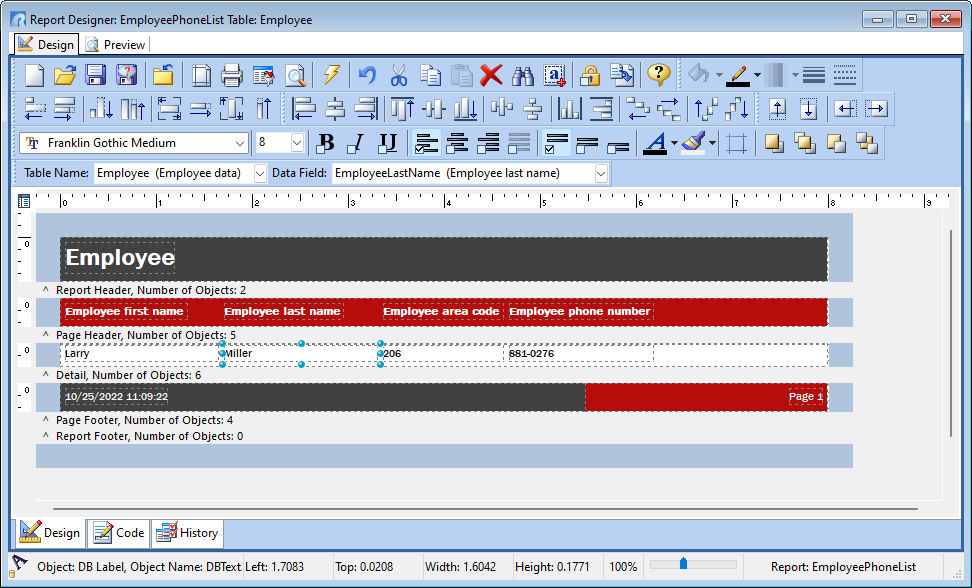
In the "Report Designer" window, the menu bar now includes menu options specific to the Report Designer: File, Edit, View, Report, and Variables.
Two tabs are located on the top left of the Report Designer screen, "Design" and "Preview". Using the tabs, you can preview the report layout before printing.
With the Report Wizard, R:BASE placed the areas where data will appear on the report. These areas are called field objects. There are different kinds of field objects that can be placed on reports. The field objects are categorized by control type, within the "Object List" toolbar, which provides options for adding new and reviewing existing form controls. These controls are used for placing different objects such as images, lines, shapes, bar codes, check boxes, text, column objects, and variable objects. Here is a list of the report toolbar controls:
•Standard Controls
•Variable Controls
•Database Controls
•Advanced Controls
Additional toolbars are available for editing the value, fonts, alignment, size, colors, format, etc. of the objects added to the report. Here is a list of these toolbars:
•Standard
•Format
•Edit
•Draw
•Align or Space
•Size
•Nudge
•Object Inspector
For additional information on each of the toolbar buttons, please refer to the Report Controls chapter in the Report Designer Help.
The Report Designer also includes the "Object List" and "Data Tree" toolbars, for the objects on the report. These are very helpful in finding objects and the properties of the objects in reports where there are a great number of items added.
Toolbars
While in the Report Designer, you can position toolbars on any edge of the client window and in any order. Detaching a dockable toolbar from the frame window is called floating the toolbar. Attaching a floating toolbar to the frame window is called docking the toolbar. A toolbar can be docked to any side of its parent window, or can be floated in its own mini-frame window. Whether the toolbars are docked or floating, you will see the hint for any toolbar button when the cursor is hovered over the button. The Report Designer will remember the last docked/floating setting when closing the designer.
When a toolbar is docked, it will look like this:

On the left side a series of characters are displayed to drag the toolbar into a floating position. The "character" can be one or more dots or pipe symbols "||" based on your operating system and current theme. The dots/pipes are used
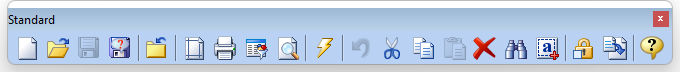
When floating, the toolbar can be moved by clicking and dragging the caption area and can be resized by clicking and dragging the edge. When a toolbar is floating, it will look like this, where a border is wrapped around the toolbar and the name and a close button (x) is displayed in the caption:
Tips:
•Double click on the caption area of a floating toolbar to dock it to the last location it was docked
•When floating, the "x" is used to hide a toolbar
•The toolbars can be docked on the sides or bottom of the screen to provide a greater work space
•From the menu bar, select the View: Toolbars option to hide or show any toolbar
There are horizontal and vertical rulers that can be set to various measurements to help you control the layout of objects on your report. Right click on the ruler to edit the ruler setting. When moving your cursor in the workspace, you will see a line move within the horizontal and vertical rulers. This allows you to place objects at a specific measurement.
The status bar, across the bottom on the Report Designer window, gives you information about the report object such as the object name, type, and coordinates of a selected object. Select some of the objects on the report to see the details on each.
By default, a report has the left margin at 0 and the right margin at 8.0 inches. The margins are indicated in the report workspace and can be edited using the Page Setup, another tool to help you alter the display of your report. The Page Setup can be located from the menu bar at File: Page Setup...
While you are designing the report, you can see the column data by choosing View: Show Data. This setting may or may not be enabled already in the Report Designer. Toggle the setting on and off to see the how the column data can be viewed. Leave the setting off before continuing.
From inside the Report Designer, you can launch the Report Designer help file by pressing the [Shift]+[F1] hot keys, or by pressing the "Help" button on the "Standard" toolbar (above).