The DB Tree Grid control displays an expandable tree structure within a grid.
The DB Tree Grid is an advanced grid, tree list, and data editor control which provides a visually stunning interface with powerful and flexible features for R:BASE applications. Customizations can include designs with standard two-dimensional tables to runtime grouping and column reorganizing. Appearance options include elegant theme and style controls to alter the display of the visual elements, which make up the grid (headers, group panel, odd/even/detail rows, footers, etc.).
Features include:
•Master/Detail grid with integrated data grouping in tabular form
•Incremental search for each column, allowing users to instantly locate any information
•Fast data loading, with speedy responses upon groups and sorts
•Automatic data grouping, enabling an extremely powerful data viewing and manipulation metaphor inside applications
•Instant summaries for grouped nodes, eliminating the need to write complex banded reports
•Instant footer summaries, generating grid displays that provide compelling data-analysis results
•Drag-and-drop column selection, allowing end-users to easily customize the columns visible on the screen
•Multiple view types for grid columns:
oBLOB Edit - displays BLOB data, such as an images and text
oCalc Edit - displays a calculator
oCheck Box - displays a check box
oCurrency Edit - edits currency value
oDate Edit - displays a calendar
oHyperlink - display text as a hyperlink
oImage - displays an image
oLabel - displays a custom label with painting options and effects
oFormat Mask - restricts the characters entered
oMemo - edits memo text
oRich Edit - displays rich text format data
oSpin Edit - displays a spin edit object
oText Edit - edit text value
oTime Edit - edits time values
oTrack Bar - displays a track bar editor that edits values using a slider
•Column data filtering to quickly limit the displayed results
•Customizable style for all visual elements which make up the tree grid (headers, group panel, odd/even/detail rows, footers, etc.)
•Banded columns to maximize the number of columns visible, when screen real estate is at a premium
•Custom row height for displaying larger row data
•Fixed bands and columns to lock columns and bands to the left or right side of the grid
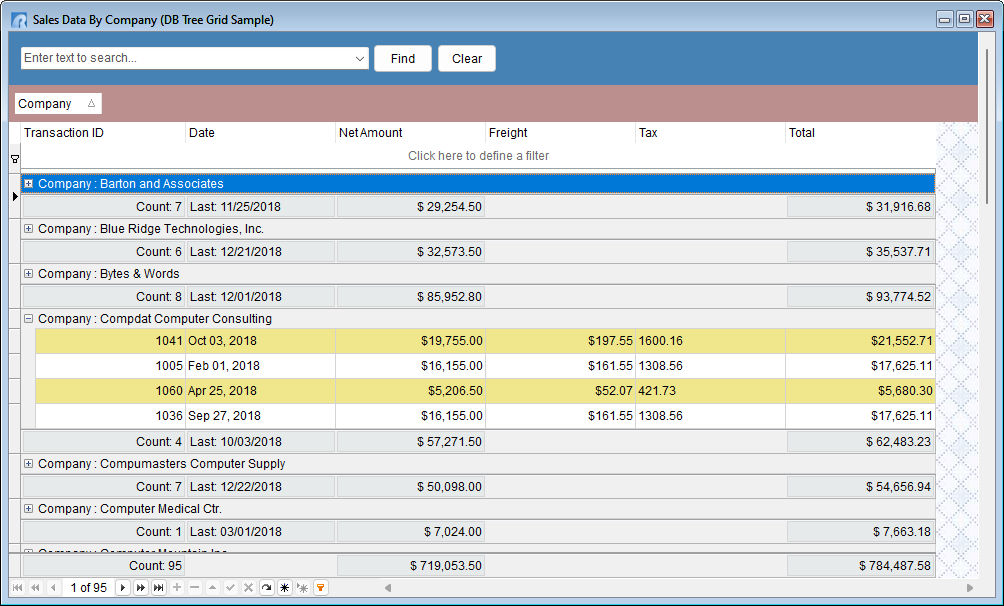
The following is an example of a DB Tree Grid control.
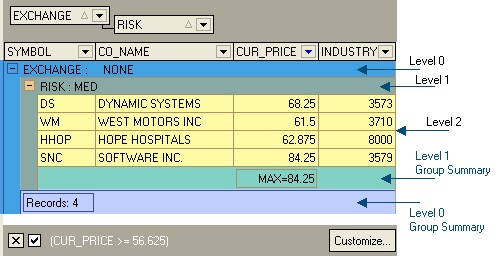
Levels
Grid data is presented via levels. If data is not grouped by any grouping item, it is displayed at level 0. If you group data, nesting levels are created. To display data at a specific level, you must click the [+] tree node button. Thus a level can be defined as a number of [+] buttons you need to click to reach the desired record.
If you group data by two grouping items, three levels are created.
Filtering Data
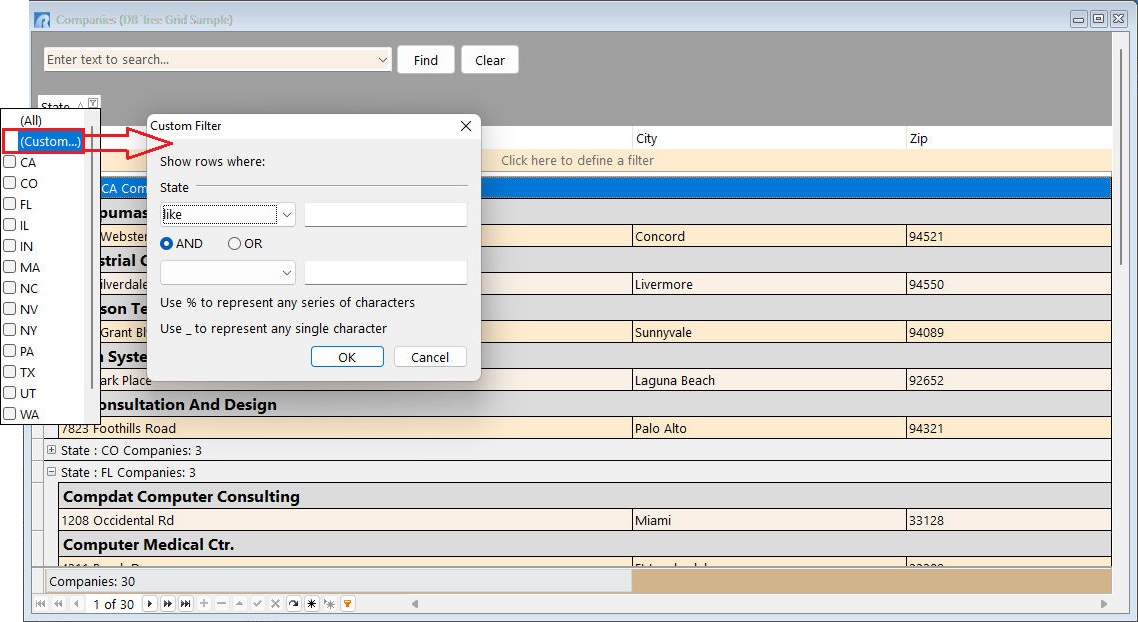
At runtime, data filtering options are available to quickly limit the displayed results.
From the Group By Header, a Custom option is available to apply a Custom Filter. In the below image, the DB Tree Grid is grouped by "State" with the State column listed in the Group By Header.
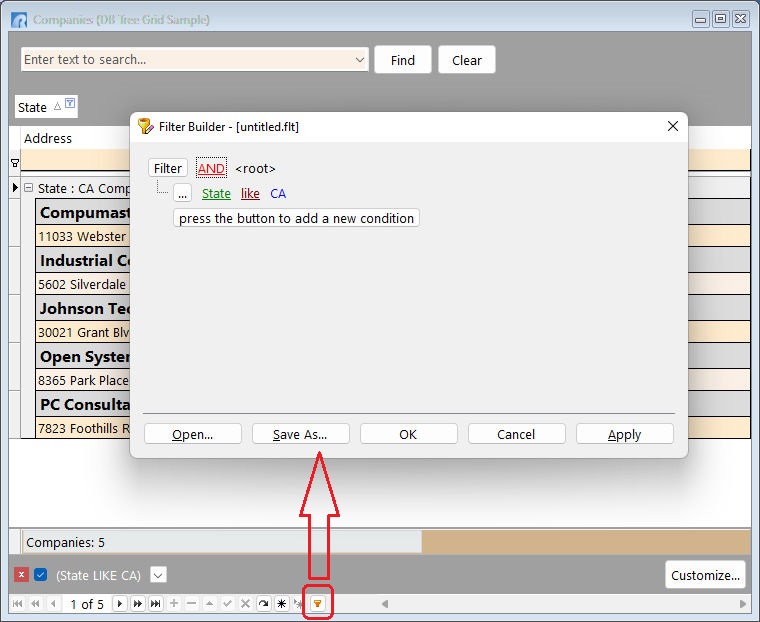
From Navigator panel a Filter Builder is available to customize a filter's criteria. The Filter Builder allows end-users to:
•Build complex filter criteria with an unlimited number of filter conditions combined by logical operators.
•Save filter criteria to files, and restore previously saved criteria at a later point.