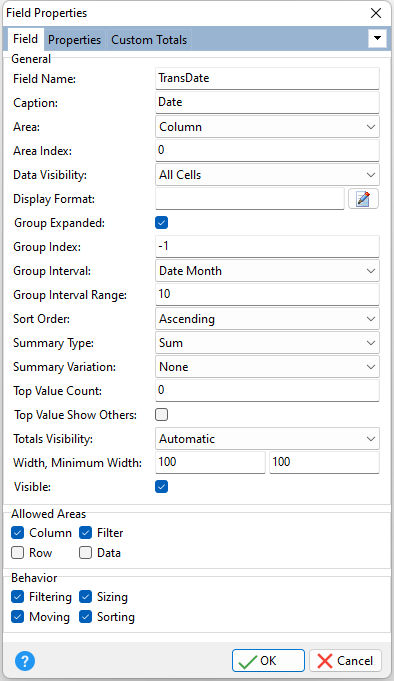
ð General Field Name Displays the field name being modified or under review Caption Specifies the display caption for the field Area Specifies the area in which the field is displayed •Column - fields are located in the column header area •Row - fields are located in the row header area •Filter - fields are located in the filter header area •Data - fields are located in the data header area Area Index Specifies the position of the field amongst the other fields within the same area Data Visibility Specifies the cell visibility for data fields •All Cells - all the field's data cells are visible •Cross And Total Cells - only cross cells and subtotal cells corresponding to the field are visible •Grand Total Cells - only grand total cells corresponding to the field are visible Display Format Specifies the formatting pattern used to display field values. Use the provided button, or press [F6] for example formats. Group Expanded Specifies the expansion state of the field in a group Group Index Specifies the index of the group in which the field is contained. Multiple fields can be combined into a group via the DB Pivot Grid's Groups property. These fields cannot be separated and are always moved together. Use the Group Index property to specify the group in which the current field will be displayed. The group is determined using its index in the DB Pivot Grid's Groups zero-based collection. A value of -1 for this property indicates that the field does not belong to any group. Group Interval Specifies how the values of the current column field or row field are combined into groups. Where date-based group intervals, the option is relevant only for fields that store date or date/time values, where the time portion is ignored. •Default - groups combine unique field values •Date - field values are grouped by date •Date Day - field values are grouped by day. The following groups can be created: 1, 2, 3,...,31. •Date Day Of Week - field values are grouped by the days of the week. Examples of such groups: Sunday, Monday, Tuesday, etc. (the actual names of the days of the week are determined by the system's regional settings). •Date Day Of Year - field values are grouped by the number of the day in which they occur in a year. The following groups can be created: 1, 2, 3,..., 365 (,366 in a leap year). •Date Week Of Month - field values are grouped by the number of the week in which they occur in a month. The following groups can be created: 1, 2, 3, 4 and 5. The first week includes the days 1 to 7, the second week days 8 to 14, the third week days 15 to 21, the fourth week days 22 to 28, the fifth week days 29 to 31. •Date Week Of Year - field values are grouped by the number of the week in which they occur in a year. The following groups can be created: 1, 2, 3,...,52, 53. •Date Month - field values are grouped by the month part. Examples of groups: January, February, March (the actual names of the months are determined by the system's regional settings). •Date Quarter - field values are grouped by the quarterly intervals of the year. The following groups can be created: 1, 2, 3 and 4. Each quarter includes three months. •Date Year - field values are grouped by the year part. Examples of such groups: 2003, 2004, 2005. •Year Age - field values are grouped by the number of years that have elapsed until the current date. The "Group Interval Range" property determines the intervals into which the values are grouped. •Month Age - field values are grouped by the number of months that have elapsed until the current date. The "Group Interval Range" property determines the intervals into which the values are grouped. •Week Age - field values are grouped by the number of weeks that have elapsed until the current date. The "Group Interval Range" property determines the intervals into which the values are grouped. •Day Age - field values are grouped by the number of days that have elapsed until the current date. The "Group Interval Range" property determines the intervals into which the values are grouped. •Alphabetical - combines field values into categories according to the character that the values start with •Numeric - field values are grouped into intervals as specified by the "Group Interval Range" property. This option is relevant only for fields that store numeric values. Group Interval Range Specifies the length of the intervals when values are grouped together Sort Order Specifies the field sort order; ascending, descending, or none Summary Type Specifies the type of the summary function which is calculated against the current field's values •Count - counts values •Sum - provides a total of numeric values •Minimum - provides the lowest value •Maximum - provides the highest value •Average - provides an average of numeric values •Standard Deviation - provides the sample standard deviation of numeric values •Population Standard Deviation - provides the population standard deviation of numeric values •Variance - provides the sample variance of numeric values •Population Variance - provides the population variance of numeric values Summary Variation Specifies how a summary value that is calculated against the current data field is represented in a data cell •None - the summary value is displayed "as is", with no variation or percentage is calculated •Absolute - the absolute variation between the current value and the previously calculated value is displayed (corresponds to the absolute variation mode) •Percent - the percentage difference between the current value and the previously calculated value is displayed (corresponds to the percentage variation mode) •Percent Of Column - the percentage of column totals is displayed (corresponds to the percentage mode) •Percent Of Row - the percentage of row totals is displayed (corresponds to the percentage mode) Top Value Count Specifies the total number of the field values that are to be displayed for the current column field or row field Top Value Show Others Specifies whether the "Others" item is displayed in the pivot grid when the Top N Values feature is enabled Totals Visibility Specifies the type of the totals calculated and displayed within the pivot grid for the current field. The DB Pivot Grid allows users to calculate and display totals (also called subtotals) only for column fields and row fields. There are two types of totals that can be calculated for these fields: Automatic totals and Custom Totals. Automatic totals are calculated using a summary function which is specified by the corresponding data field via the above "Summary Type" property. Custom Totals can be calculated using any summary function, and users can calculate multiple custom totals for a data field. •Automatic - automatic totals are calculated •Custom - custom totals are calculated. Use the field's Custom Totals collection to specify custom totals and the summary functions that will be used to calculate them. •None - totals are not calculated for the current field Width, Minimum Width Specifies the field header's width, and the minimum field's width Visible Specifies if the field is visible
ð Allowed Areas Column Specifies the the field can be positioned in the column header area Row Specifies the the field can be positioned in the row header area Filter Specifies the the field can be positioned in the filter header area Data Specifies the the field can be positioned in the data header area
ð Behavior Filtering Determines whether a field can be filtered Moving Specifies whether a field can be dragged by end-users or not Sizing Specifies whether the field's width can be changed by end-users or not Sorting Specifies if end-users can change the field's sort order |
|