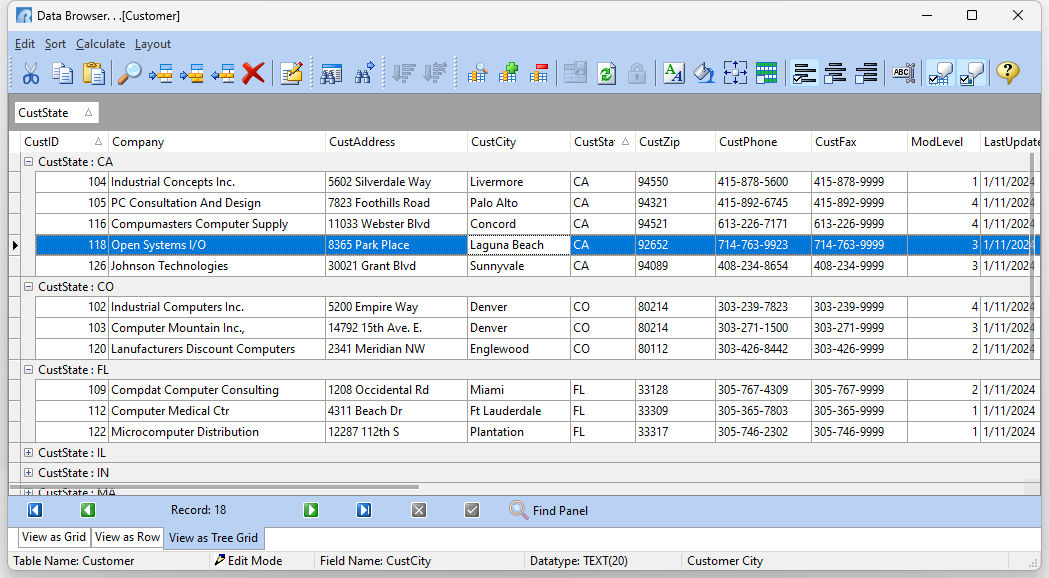
The Data Browser/Editor displays data from tables and results of queries in a tabular or tree grid format. The displayed data results may be altered with query updates and filters. Calculations can be performed on the table data using built-in aggregate functions, tally, group, and crosstab. Users can also modify the layout of the data in the Data Browser/Editor by performing the following:
•Alter the size of the cells in the table
•Alter the text and background colors of individual columns
•Sorting the order of the data
•Rearrange the column order
•Show and hide columns
In addition to viewing the data, you can analyze the data by performing various calculations, such as finding the minimum and maximum values in a column, summing a column, counting the number of occurrences for each value, and so on.
Users can switch from Browse Mode to Edit Mode in order to make changes to the table data. To switch modes, users can select "Edit" > "Edit Mode" from the menu bar, press the "Switch Browse/Edit Mode" button on the Edit Toolbar, or press the [F4] hot key.
