The report break output displays data rows grouped by the values in a specified field. An example would be a grouped summary of orders by region.
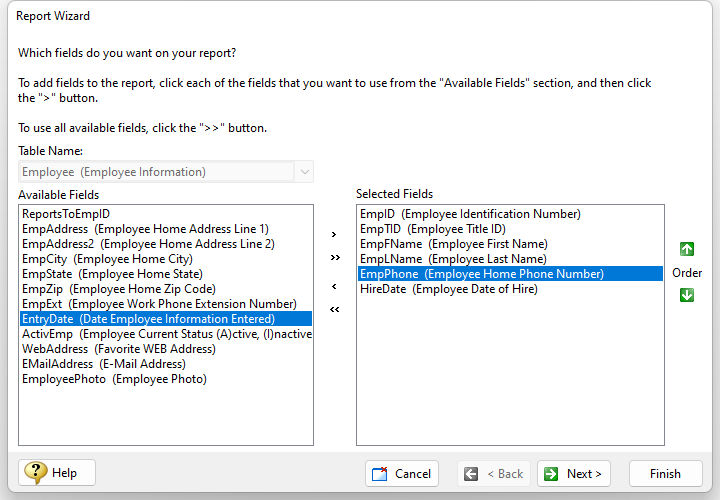
When launched, the wizard displays a list of the field in the selected table. The field names and description (if exists) will be provided. Because a report may not require all available fields, only the desired fields may be included in the output.
Using the arrow buttons between the "Available Fields" and "Selected Fields" panels, move any fields that must appear on the report. Use the double arrows to move all of the fields at once. The green arrows for "Order" allow sorting the columns.
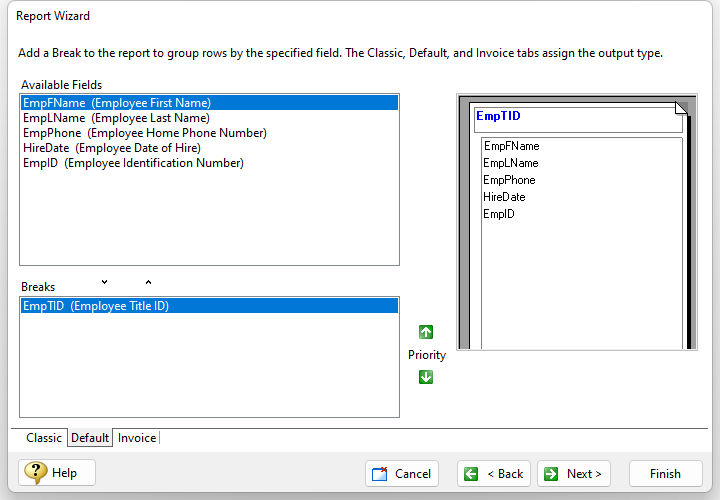
Next, the wizard will prompt to place a Break, which groups rows by the values in a specified field, and to select the report output type. Using the arrow buttons between the "Available Fields" and "Breaks" panels, fields can be added as breaks. The preview panel provides an example of how the report break grouping will appear. The green arrows can be used to specify the break priority for the fields.
The "Classic" and "Default" tabs are specifically related to the styles. The Default tab specifies the six available styles will use more current and stylish presentations which were introduced in R:BASE 10.5. The Default output type also applies automatic zebra stripe coloring for the Detail band dataset in the generated reports. The Classic tab specifies the six available styles will use the font and display presentations included with R:BASE versions 7.0 through 10.0. The Invoice tab is used to create invoice output.
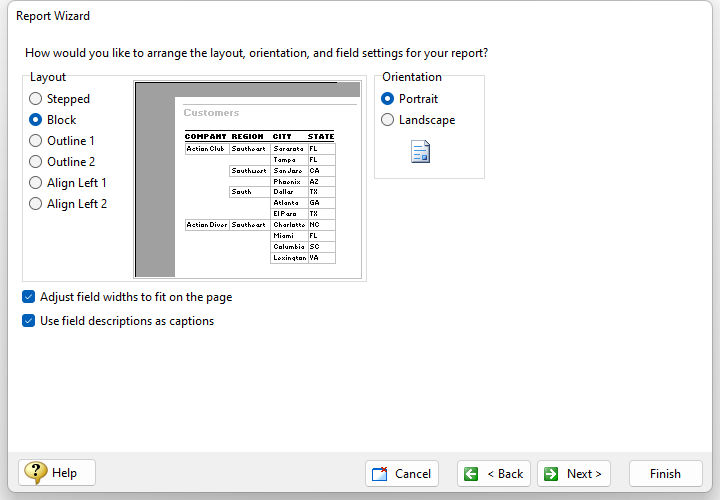
The Report Wizard next provides layout, orientation, and field setting options for the report.
•Layout - determines the field arrangement. The preview panel provides an example of how the report will look. The layouts offer a variety of placements based upon the levels of Breaks added.
•Orientation - specifies if the report uses the Portrait or Landscape page setup
•Adjust field widths to fit on the page - specifies the object widths will be adjusted to fit on the page, where many fields are specified in the report output
•Use field descriptions as captions - specifies the field descriptions are applied to label objects associated to the corresponding field object
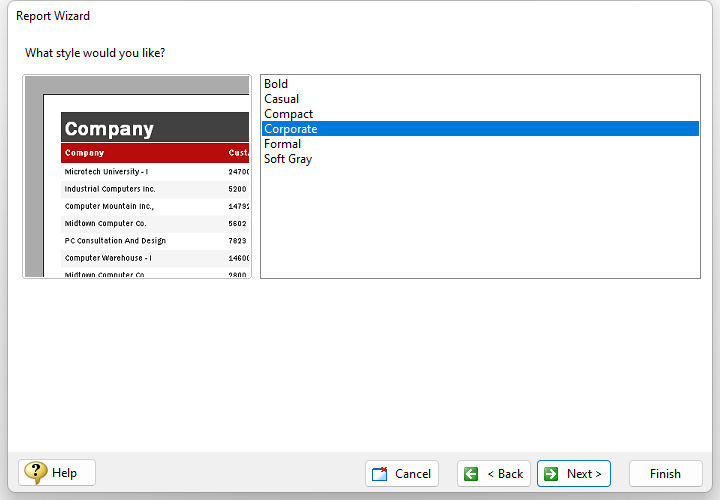
The option is then provided to specify a style for the report. Select each of the items in the list to preview the color schemes and fonts. If the intent is to conserve printer ink, the "Compact" and "Soft Gray" styles would be suitable.
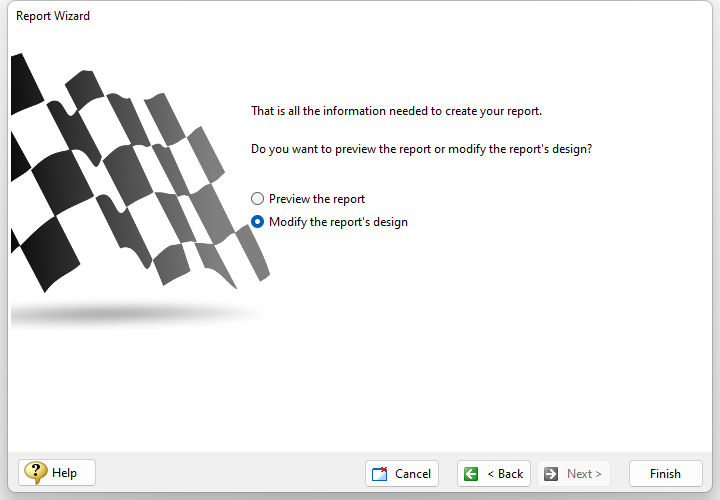
The final option prompts to preview the report or modify the report's design. Either option will display the report in the Report Designer, within the "Preview" or "Design" tab respectively. The Report Wizard then uses the selected information to build the report.
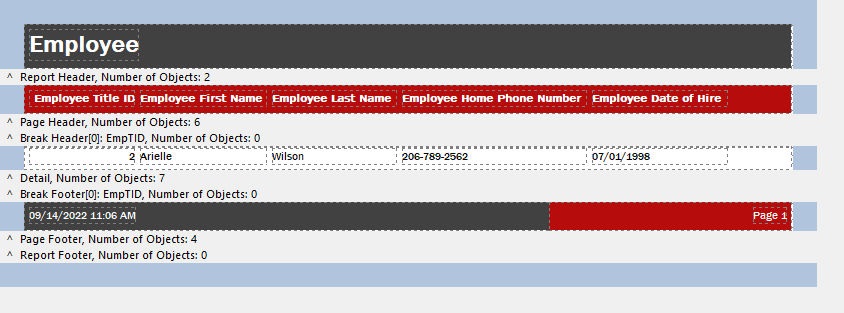
The wizard will then build the report and display it in the Report Designer window. The wizard placed the table name within the Report Header band. The field captions are listed as Label objects in the Page Header band. A Break Header and Break Footer band is defined for the field specified in the Break screen of the wizard. For multiple breaks, there will be multiple Break Headers and Break Footers. The table details are listed as DB Label objects in the Detail band. And finally, the date/time stamp and page number items are listed as System Variable objects within the Page Footer band.
The ability to alter the report controls and add new items is detailed within Lesson 5 of the R:BASE Tutorial.